
This is the last post of this series. Previously we have seen how to download market data from a public web based feed, and how to display them in graphical charts. Today we will see an example of technical strategy backtester (BT).
Background
When it comes to trading in the financial market, there are two major categories of criteria one can adopt to take operational decisions: Fundamental and Technical.
Fundamental criteria are those that derive from an analysis of the quality of the traded asset. The investor makes assumptions on the discrepancy between the price offered by the market for the asset and the “real” value she perceives based on the information she can gather about the asset.
Technical criteria, instead, ignore completely that fundamental information and concentrate on the price behavior in time. The technical trader takes decisions based on elements that can be determined only by the past prices of the asset under consideration. Mostly technical trading is based on the observation of a graphical chart of the asset price, possibly augmented with additional “studies”; these “studies” can have various shapes: they can be graphics as well, or perhaps simply numbers. What matters, though, is that they originate from only the price itself. Behind technical trading there is the conviction that “Market price discounts everything”.
Of course nothing forbids to combine the two kind of trading, and as a matter of fact probably most traders do so.
When it comes to computers, one would think that they are primarily applied to technical trading due to their numbers-crunching nature, and less useful in fundamental scenarios.
The fact is, history has shown that the human brain is capable of things without actually being able to conceive a clear explanation of how it does them. And without this explanation the question “how can we make a machine that does that” remains equally unanswered.
Artificial Intelligence and Machine Learning, on the other hand, have demonstrated that computational architectures, inspired to the (so far known) structure of the brain (neural networks), but completely uncorrelated to the nature of the problem to solve, manifest the astonishing capability to learn from experience properties that we wouldn’t be able to codify analytically.
I’ll dive a little more in this Machine Learning adventure in a future publication.
Understanding technical trading
In a technical trading strategy, we define conditions that, when verified, trigger a specific market operation. These conditions regard the asset price or one of the superimposed studies I mentioned above. Let’s see a few examples
- Buy/Sell when the price crosses its 20-periods simple moving average. In this case we compare the current price (a.k.a spot) with the value of the average of the prices in the previous 20 periods. When the price moves from being lower than the average to being higher than it, we buy the asset. Vice versa, when the price moves from being higher to lower, we sell.
- Buy/Sell when the 20 and 50 period moving averages cross. This is analogous to the previous, only here we look for the cross of two “different speed” averages.
- Buy/Sell when the stochastic oscillator crosses from below to above the level of 20. The stochastic oscillator is one of the uncountable indicators available. It is always calculated from the price, but the result of the calculation gives a number in the range 0..100. Usually, values above 80 are said to be “overbought” and indicate a greater (statistically) chance for the price to drop. Analogously, values under 20 tell that the asset is “oversold” and (statistically) near to a upward swing.
We can metaphorically think to price as the alphabet, studies as words, and strategies as essays, and we rapidly realize that there are uncountable combinations.
One of the master tools to evaluate the profitability of a strategy is backtesting. We go back in time and apply our strategy simulating actual trading on past data. This of course doesn’t give any guarantee that the strategy would perform equally in the future, but our odds are better if we use a strategy that has demonstrated to be “historically” profitable rather than one that hasn’t.
Backtesting is the “fundamental” tool for the “technical” trader, and perhaps what mostly differentiates technical trading from gambling.
Computers give a twofold help in this endeavor:
- They allow to backtest a strategy in a minuscule fraction of the time we would spend doing it manually (a.k.a paper trading)
- They physically operate on the market applying the strategy on our behalf (a.k.a. algorithmic trading), which not only relieves us from the burden, but also makes possible scenarios like portfolios with many assets or high frequency trading
Disclaimer
Please note that
- The scope of this post is to show how to write backtest software in F#, NOT how to find or recommend a profitable strategy
- None of the strategies indicated in this post have to be considered trad-able in live markets. They are only suitable examples to demonstrate the features of the backtest software presented
Understanding BT
BT is used as follows
- First of all we determine the (technical) strategy to be tested
- As a result, we list the market data we need; typically one or more instruments and zero or more indicators
- We write a function that BT will call (as callback). Later we’ll see how.
- We call a backtest function passing both the market data and the callback
- We receive as returned result a backtest report containing the list of trading operations and the final financial result of our strategy (profit or loss)
Let’s see a concrete example to clarify the process and introduce some code
MSFT SMA20/SMA50 crossover
1.Strategy
We trade the daily timeframe. We buy when the fast SMA (SMA20) crosses the slow one (SMA50) upwards; we sell when the cross occurs downwards. The chosen asset is Microsoft stock (symbol MSFT)
2.Data
We need to download the MSFT stock and the two indicators
let msft = getStock "MSFT" DAY
let geti = getIndi "MSFT" DAY
let sma20 = SMA (20, Close) |> geti
let sma50 = SMA (50, Close) |> geti
3.Callback
The backtest type is defined as
type BackTest = {
    Market : MarketData seq
    Strategy : IBacktestStatus -> unit
}
where MarketData has been explained in the previous posts and the interface IBacktestStatus is
type IBacktestStatus =
    abstract member GetInstrument : symbol:string * offset:int -> OHLCV option
    abstract member GetOpen : symbol:string * offset:int -> float option
    abstract member GetClose : symbol:string * offset:int -> float option
    abstract member Trade : symbol:string * shares:int -> bool
    abstract member GetIndicator : id:string * offset:int -> float option
    abstract member GetTime : offset:int -> DateTime
    abstract member GetPosition : symbol:string -> (int * float) option
Our strategy callback, therefore, needs to be a function that receives an IBacktestStatus instance as argument and returns nothing (unit in F# terms)
Here is our strategy for this example
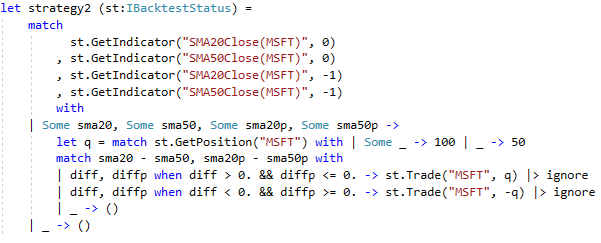
BT calls the callback strategy function once for every period in the range of market data (Alpha Vantage has 20 years of daily data available). The interface IBacktestStatus gives to the user a well-defined set of methods that the strategy can call. Most of them are queries (Get*) on the status of the simulation and there is a Trade method to be called when the strategy decides to take action on the (virtual) market. Most of the Get* methods have an offset argument of type int. This has the meaning of offset with respect to the current call’s period; in this case, as we are trading a daily timeframe, 0 means today, -1 means yesterday and so on. Also, the Get* methods return Option values: this is because, in general, it is possible that some market data are missing. The strategy operates as follows
- Check if we have valid market data for today’s and yesterday’s indicators (SMA20 and SMA50); if not then do nothing and return (step to next period, day in this case). If yes
- Check whether we already have an open position; if yes, set q to 100, otherwise 50
- If SMA20 crosses SMA50 upwards, buy q shares, if SMA20 crosses SMA50 downwards, sell q shares
4.Run backtest
Our BT is called with a function defined in the Backtest module
let market2 = [msft; sma20; sma50]
{Market = market2; Strategy = strategy2} |> Backtest.backtest
5.Display report
We now display in a chart, using our generic show function (see previous post), both the market traces and the trading operations executed during the backtest.
let report2 = {Market = market2; Strategy = strategy2} |> Backtest.backtest
show (report2, market2|> List.toSeq)
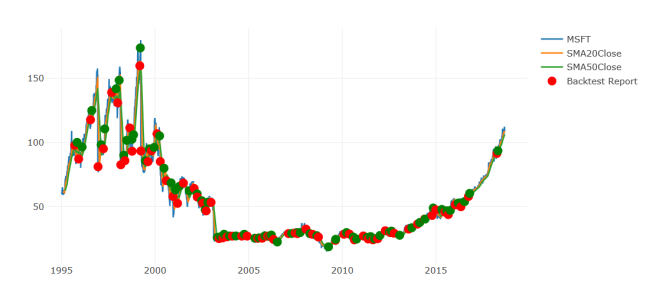
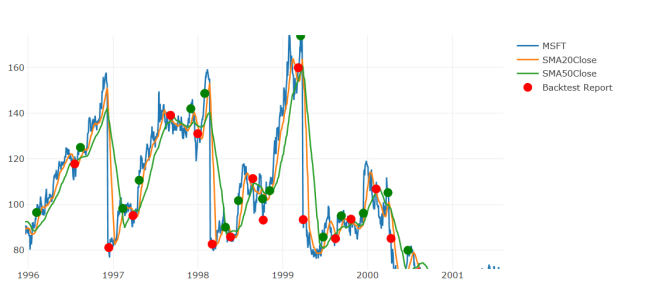
With a zoom in a part of the chart we can see better the various components; the green dots are buy trades, the red ones are sell trades.
Additional notes
The full code can be seen in github. We focus on few specific points here
Backtest iteration loop – tail recursion
Below we see the backtest function. To be noticed the tail recursive embedded function (iterate); tail recursion is another of the important features F# provides.
module Backtest =
    let backtest test =
        let status = BacktestStatus(test)

        let rec iterate() =
            status :> IBacktestStatus |> test.Strategy
            if status.Next() then iterate()

        iterate()
        status.FinalReport
Functional languages tend to prefer an expression based code-style to an imperative one. This preference has several reasons, as for example data immutability (advantages/disadvantages of data immutability in programming are largely explained by other authors, see Scott Wlaschin for an F# flavored instance).
One context where this orientation manifests itself is iterations. Despite offering imperative loop constructs (like while and for), in F# we can make iterative code using a recursive functions. The iterate function above continues to call itself until the conditions to conclude the loop (status.Next()) are satisfied. However, it is important to remember that function calls are usually associated with the stack, where return addresses and arguments are stored. A long iteration based on recursive call could lead to stack depletion and the abhorred “stack overflow” runtime exception.
To avert this risk, F# (and other functional language compilers) do something more than the good old C (and other even modern) compilers. They are capable to detect if the function is “tail recursive”. A function is tail recursive when (in simple terms), its last instruction is the recursive call. Or, more precisely, if there is nothing left to do after the recursion call returns. In the iterate function above, the recursive call is the very last instruction, and it is not part of an expression whose value needs to be calculated AFTER the call returns.
Recognizing the function as tail recursive, an optimizing compiler will simply generate a jump to the beginning instead than a call+push, so that our expensive recursive loop becomes lean exactly as an imperative loop.
For more information on F# tail recursion the reader can see here for example.
Aligning data with Deedle
Let’s have a look at the first code lines in the BacktestStatus class type
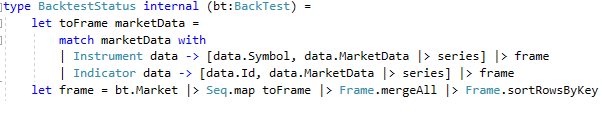
What we are doing here is taking all our market data and transform them in a Deedle Frame. A Frame in Deedle is a data structure with a number of useful features to treat in-memory-data. Deedle offers utilities to operate both on series and frames. We can think to a Deedle Series as a collection of “labeled values” (similar to a dictionary), and to a Deedle Frame as a collection of “labeled uniform series”. Visually a frame can be thought as a worksheet or a database table: a Deedle Series is equivalent to a row in the worksheet/datatable, which is a collection of values with a label (in a worksheet the labels could be the name of the column, traditionally A, B, C…, in a datatable it could be the field name in the table schema definition), and a Deedle Frame is equivalent to the worksheet or datatable, which is a collection of rows labeled by an identifier (in a worksheet it could be simply the row number 1, 2, 3…, in a datatable one of the fields normally plays the role of record identifier, often merely an automatically incremented number).
Deedle offers primitives to manage datasets in memory in an efficient way, including sorting, grouping, statistics and much more.
In the toFrame function above, we take our Instrument or Indicator and pipe it to the series Deedle generic function. The returned entity is then coupled to our choice of column identifier (Symbol for Instrument, Id for Indicator) and piped again to the frame Deedle generic function. What we get by doing this is a Deedle Frame for every instrument and indicator in our market dataset. The column label is the Symbol name for the instrument (like “MSFT”) or the id for an indicator (e.g. “SMA20Close(MSFT)”) and the row label is the time that identifies the period (day in our examples) of the sampled value stored in that row.
Something useful happens when (let frame=…) we merge (Frame.mergeAll) all those single-column frames together in a single frame, because Deedle automatically aligns all the constituent frames: we can finally index rows with a time and get all the correspondent values for that period.
Another nice thing the reader may have overlooked is the fact that in creating our column series, we did not expand the instrument samples (which are F# record type instances OHLCV, see previous posts) to their numeric components. In our final frame, instrument column’s cells contain composite record instances, while indicator columns contain plain float numbers. This is something hard to achieve when using a worksheet or a datatable (at least plain old SQL tables), and opens interesting scenarios when it comes to data computation. By the way, Deedle offers utility primitives to easily expand composite columns into multiple base type columns.
How BT manages Trade operations
The backtester implemented in this publication has only demonstration purposes; my objective is to show a possible implementation of such a functionality using F#. The central method is Trade, let’s see how it operates and some of the limits
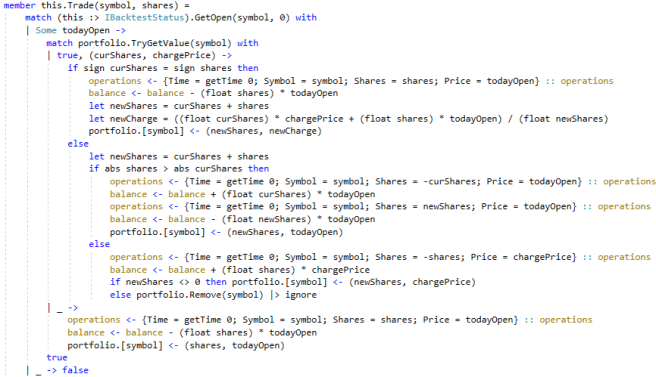
- It can manage portfolios with multiple instruments
- It maintains one single position per instrument. For example, if we trade -2000 shares of instrument INS when our portfolio includes already +1300 INS shares, BT will sell 1300 shares and short 700, resulting in a net position of -700 INS shares
- It allows short selling
- It does not consider trading costs (commissions, borrowing fees, interest rate differences…)
- It doesn’t check margins, or, in other words, it assumes that there is always sufficient margin
- It doesn’t compensate for online market inefficiencies (slippages, liquidity, delayed execution)
- It doesn’t calculate simulation summaries (e.g. maximum drawdown), the returned report contains only the list of performed operations, the cash balance and the portfolio at the end of the simulation.
Conclusion
This post concludes this mini series regarding how to implement a technical trading backtester in F#. Algorithmic trading is an interesting software engineering application area and I hope this publication gives some clues on how F# and its echosystem are well suited to have an important voice in future developments.
I am working these days to other ideas around F# in the financial arena that I will (hopefully have the time to) publish later this year. Black-Scholes modeling and Machine Learning are among them.
Please feel free to drop comments or ideas.

Can I make a suggestion:
if you define:
type State = { Time: DateTime; MarketData: MarketData; Portfolio: Portfolio }
type Order = { Symbol: string; Shares: int }
Then a strategy is just a pure function:
State -> Order list
And the state can be moved forward through trading and new market data:
Order list -> DateTime -> State -> State
I think this is a more functional approach and hence benefits from being more testable, composable, reusable etc.
LikeLike